Ad Hoc Grid |
  
|
Ad Hoc Grid |
|
The Ad Hoc Grid is a powerful data-viewing tool for system managers.
It provides in-depth features for viewing Stats, Stats Archive, Report Index, Voice, UserLog, and Commitment table data, with complex arranging, sorting and filtering capabilities. Results can be exported to Adobe PDF, Microsoft Excel, or Comma Separated Value format files for use in other programs.
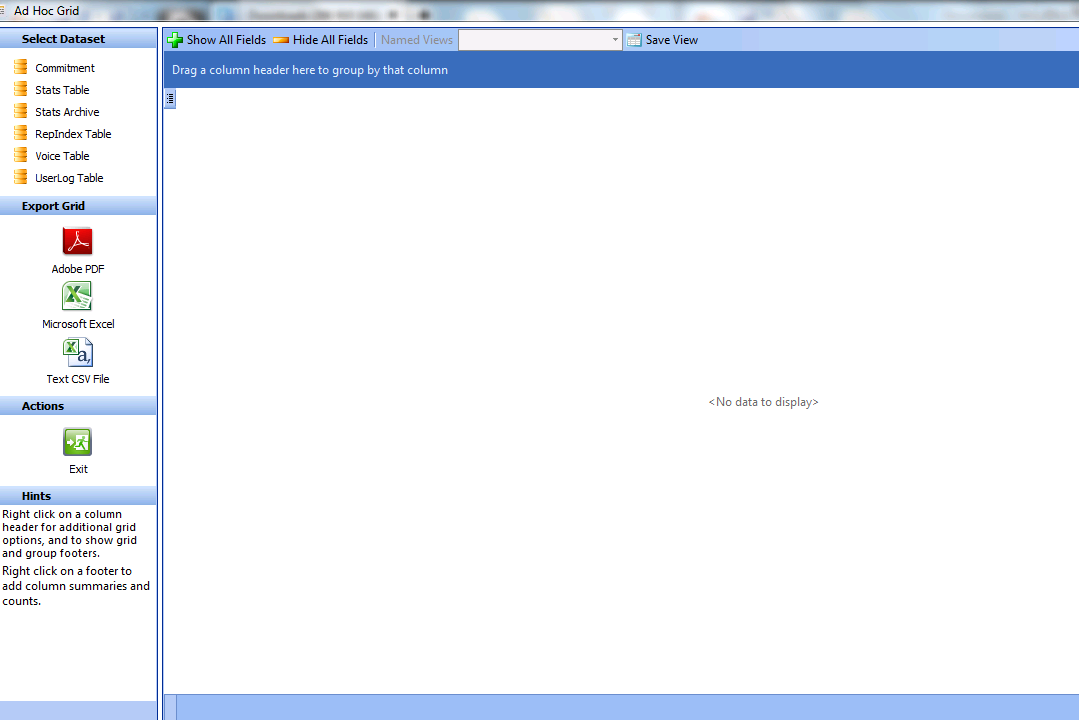
Choose which table data you want to view in the Select Dataset panel at the upper left corner. You will be presented with the standard ChartNet Search dialog. Enter your search criteria, and the system will retrieve the matching data. Note that depending on the amount of data being retrieved, the system load, and connection speeds, it may take a minute or two to return your search results.
Export Grid
The data displayed in the grid can be exported to a Comma Separated Value (CSV) file, a Microsoft Excel spreadsheet, or as an Adobe PDF file. When exporting to PDF, you will be given the opportunity to protect the document with a password.
Arranging the Grid
The Ad Hoc Grid also supports several other useful features. You can use the Show All Fields and Hide All Fields buttons, as well as the Column Chooser button in the upper left corner of the grid, to select which fields you want displayed on the grid. You can rearrange the individual columns around by dragging the column header, sort columns by clicking on the column header, and filter the column values by clicking on the filter icon, visible when you mouse over the column header. These functions and more are also available by right-clicking on a column header, which will display a pop-up menu.
Column Chooser |
|
Column Filter |
|
You can group data by dragging column headers onto the dark band along the top of the grid. You can rearrange the grouping by dragging column names around, and remove a column from grouping by dragging it back onto the grid.
Summaries
Along the bottom of the grid is a footer area where column summaries can be activated. Right click on the footer below a column, and choose one of the functions (Sum, Min, Max, Count or Average) from the pop-up menu.
Saving and Loading Views
If you have come up with an arrangement of data that you would like to be able to recall in the future, you can save a Named View. Click the Save View button in the toolbar, and you will be prompted for a name to give the current view. Later, when you open the same dataset, all of your named views will be available via the Named Views combo box in the toolbar.